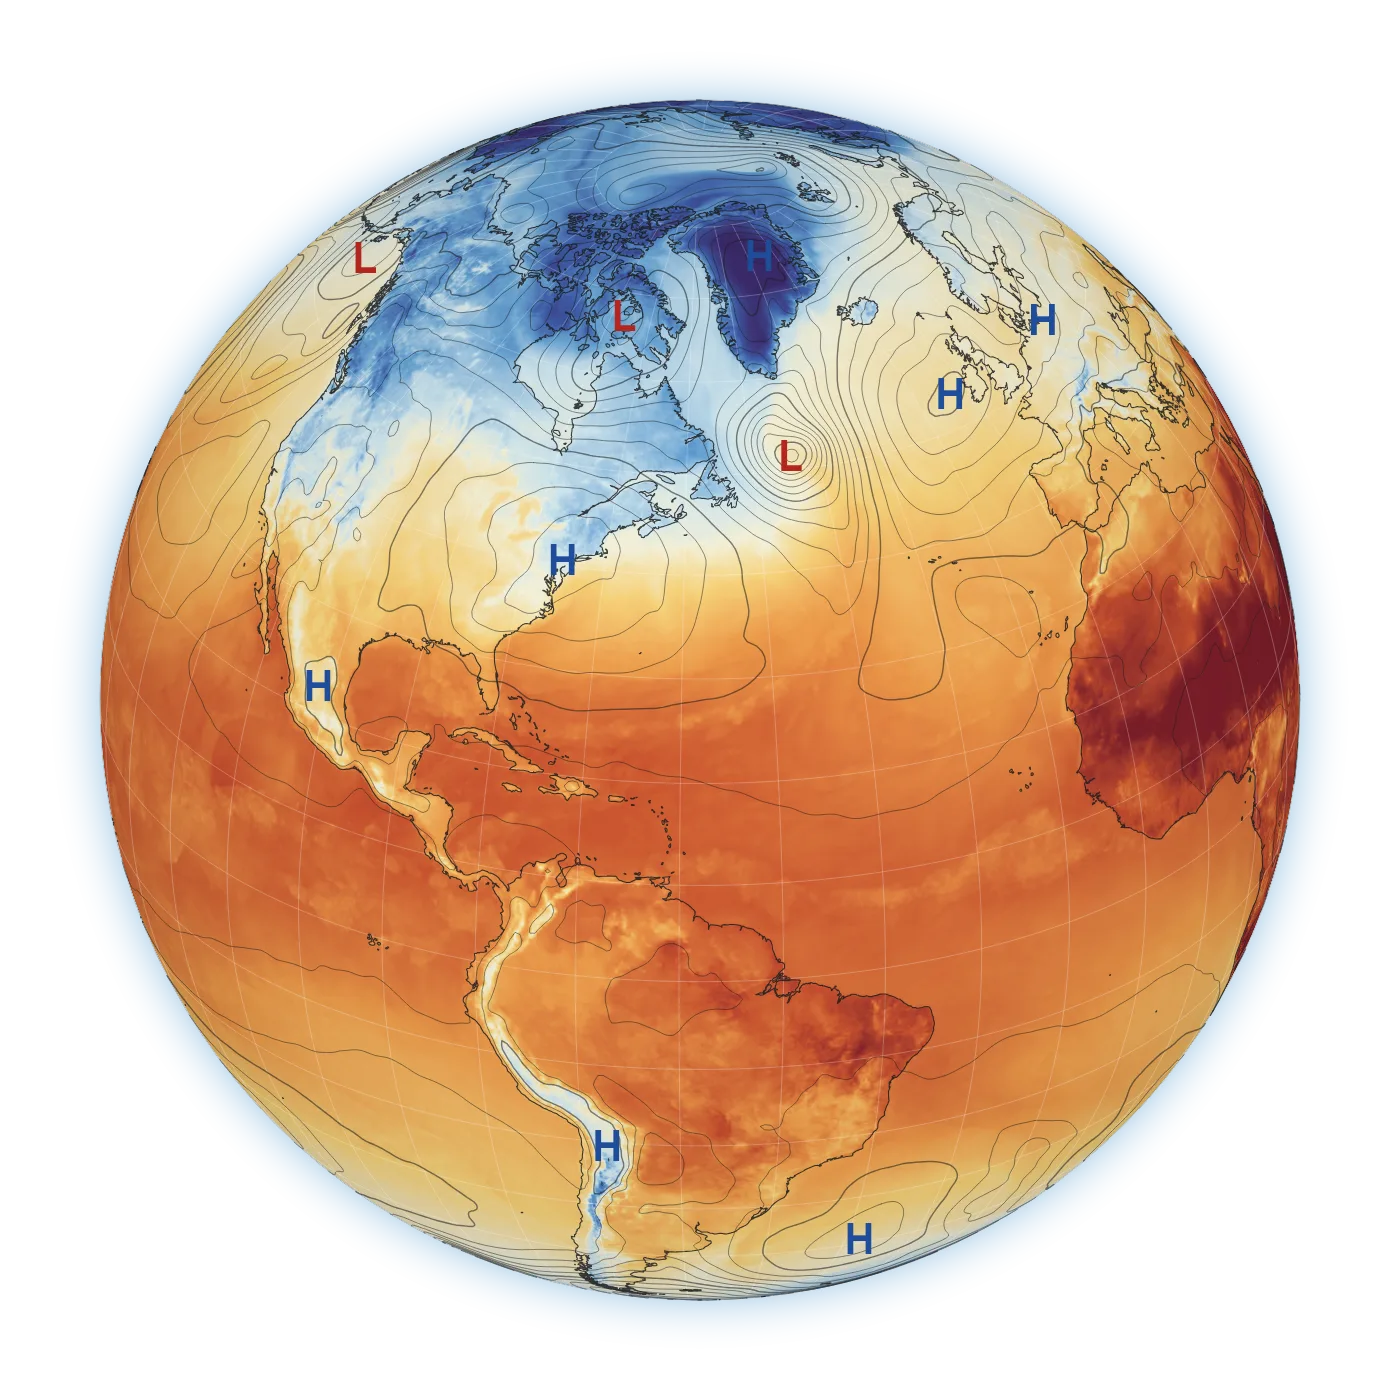
ERA5 reanalysis
Hourly, 0.25°, from 1940 to within a few days of now. Read straight from the ARCO ERA5 Zarr store, chunked for fast slicing through time.
One map, a loop of them, the mean of a hundred, or the days that looked most like this one.
Any six hours since 1 January 1940, over any of two dozen regions, in a projection that suits it. Twenty-one fields: heights and vorticity, the jet, 2 m temperature under isobars, thickness and precipitation, PV on the dynamic tropopause, frontogenesis, Q-vector convergence.
Six, twelve or twenty-four hours apart, up to a month of analyses. It plays in the page and exports as an MP4 or a GIF at 4K.
List the dates, or name whole months, and the map is their average. Shade the anomaly from 1991–2020 and it stipples where the cases actually agree — a two-sided t test at 95%, not a mean that hides its spread.
The same composite stepped from days before the cases to days after, so a set of storms plays as one storm: where it came from, what it did, where it went.
The archive days whose 500 hPa height and sea-level pressure anomaly pattern most resembles a target over the region, their composite, and “play what followed” to turn them into a lagged one.
Every map is a permalink: the whole recipe is in the address bar, so a map you can see is a map you can send. And every map shows the grads3 script that made it — the same text runs unchanged in a terminal against the same store, so the picture is never the only copy of the method.
Behind it is the Replay slab: ERA5 every six hours since 1940, one field to an array, about a megabyte a time instead of the public archive’s hundred and fifty. That is what makes a thirty-case composite a map you wait a moment for rather than one you plan an afternoon around.
Maps — any ERA5 analysis since 1940, looped, composited, lagged or analogued, drawn by grads3 from the Replay slab. The page is built and on its rails; it is waiting on its engine and its slab. See where it stands →
Name a moment. The week around it is waiting.
Every hour is an ERA5 analysis — the atmosphere as it stood, not an average of the day around it. Loop a day, two days, or a week six-hourly.
What needs a whole day to exist: rain and snow summed over the local day, and the highest and lowest temperature it reached.
Every month since January 1940, as a mean or a departure from normal, with the record at any point you pin and the month's teleconnections beneath.
Frames are drawn ahead of time and served as pictures, so stepping through them is as quick as a slideshow: no render queue, no waiting. The same map options as the rest of the network — colour tables, projections, boundaries, relief, PNG, MP4 and GIF.
One number a year says the Earth is warming. It cannot say where.
Every October of 2016–2025, area-weighted over the whole globe, against the fixed 1991–2020 mean. This is the number that usually stands in for all of it.
The belt just inside the Arctic Circle, over the same ten Octobers against the same reference. Three times the global figure, in one 2° band.
A belt of the Southern Ocean, same ten Octobers, same reference. Half the global figure. Averaging it with the Arctic reports a planet neither belt lives on.
Every year a column, every 2° band of latitude a thread: 86 Octobers from pole to pole, and the same slice again as one calendar day. Each cell is an exact area-weighted mean of its belt — all longitudes, land and ocean — painted with the site's own departure ramp. A band missing a single cell has no value and says so.
The playhead slides from 1940 to two weeks from now. Behind it, Replay hands off between datasets on the same grid, so a loop can start in the archive and end in the forecast.
Reading live coverage…
Hourly, 0.25°, from 1940 to within a few days of now. Read straight from the ARCO ERA5 Zarr store, chunked for fast slicing through time.
Fills the days until ERA5 catches up, cycle by cycle, on the same 0.25° grid so the handoff is invisible on screen.
The newest runs out to 15 days. Runs since 1 March 2024 stay replayable, so you can play what a forecast said against what actually happened.
Drop the playhead on any hour since 1940, or start from a moment in the Replay Deck.
Keyframe the camera: spin the globe, push in on a storm, hold on a coastline. Stack layers like tracks in an edit.
Subscribe to a theme channel. Palette, type, lower thirds and credits come with it, so every clip lands on brand.
Frames render to lossless PNG, then mint to MP4, a seamless GIF loop, or a single still at 3840×2160.
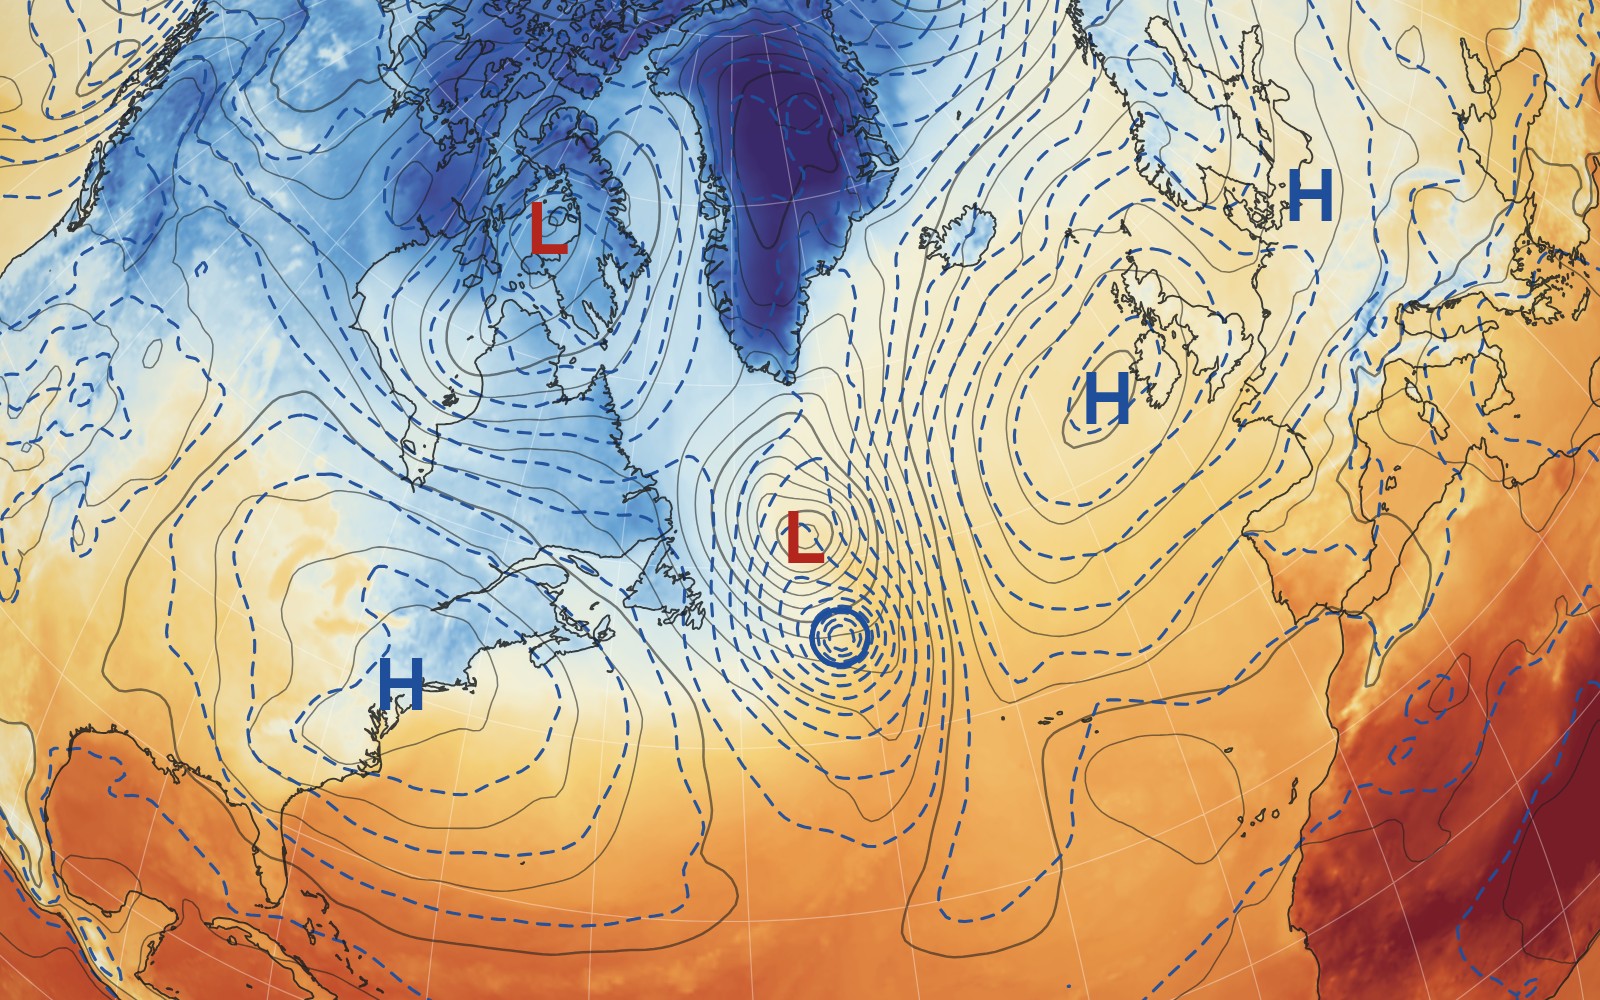
Pin a past forecast run as a ghost layer and play it over what verified. Watch a low drift off track, a ridge build early, a cold front arrive late. The miss becomes the story.
These came before the archive map and they all still work — same addresses, same data, same timers behind them. They are off the nav because one site can only lead with one thing, not because any of them was finished with.
Replay Studio runs in the browser on any desktop. Renders happen next to the data, so your machine just watches.